SPAIN
Growth
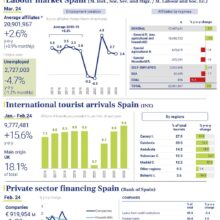
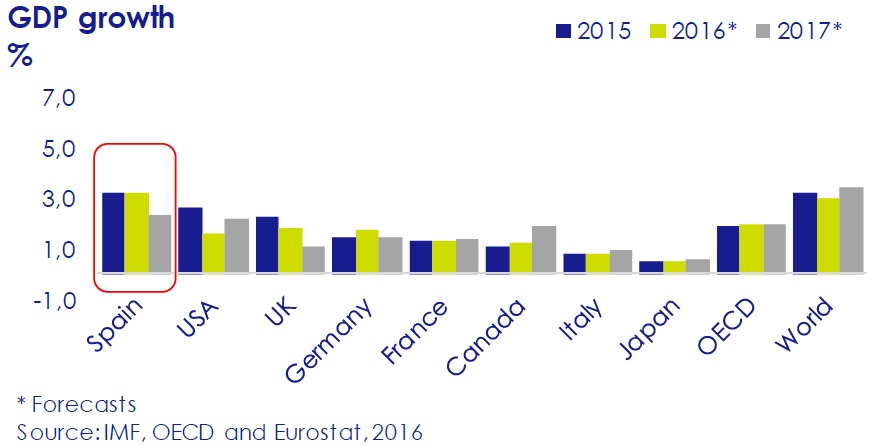
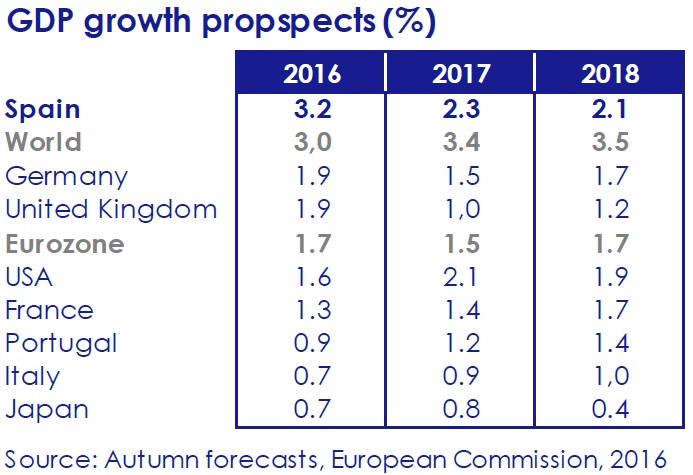
After Ireland, Spain is the OECD country whose economy is growing the most. Domestic and international predictions calculate this growth at 3.2% in 2016 and at around 2.4% in 2017 (Eurostat and FUNCAS).
Labour market, October 2016 (Ministry of Employment)
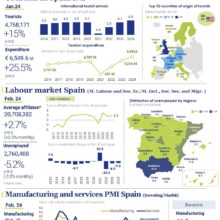
Unemployment is at its lowest levels in the past seven years. It is now at 3,764,982 persons, after dropping 9.85% year-on-year (-411,387 persons). Among people under the age of 15, it was reduced by 53,025 persons (-14.24%).
The number of new contracts in October totaled 1,867,360, the highest figure in the past 9 years (+6.06% year-on-year), of which 166,830 are permanent contracts (+10% year-on-year).
Social Security affiliation is 17,813,356 persons, 3.44% more than a year ago, the largest increase since 2005.
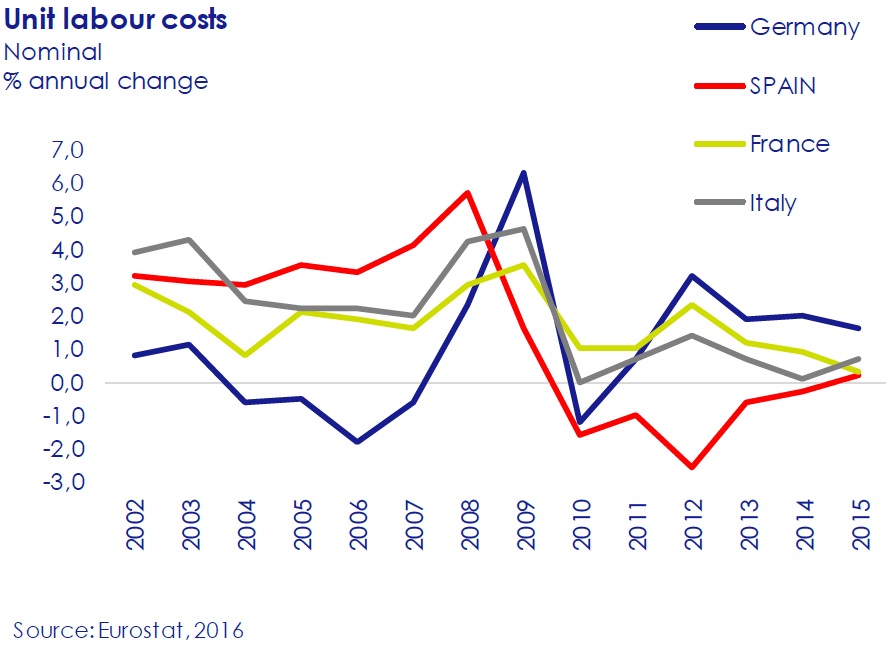
Unit labour costs
According to a recent Natixis report, since 2007, Spain has gained competitive advantage with regard to Germany, France and Italy, principally because of the drop in its unit labour costs, which is explained by internal devaluation. The report also stresses that Spain has a degree of sophistication in its
production (sensitivity of its exports to pricecost) similar to that of Italy and France. As a result, this drop in costs has favored the increase in exports, investment and employment.
CPI October 2016
The annual rate of change in the CPI in October was 0.7%, or 5 decimal points above that of September, with underlying inflation at 0.8%.
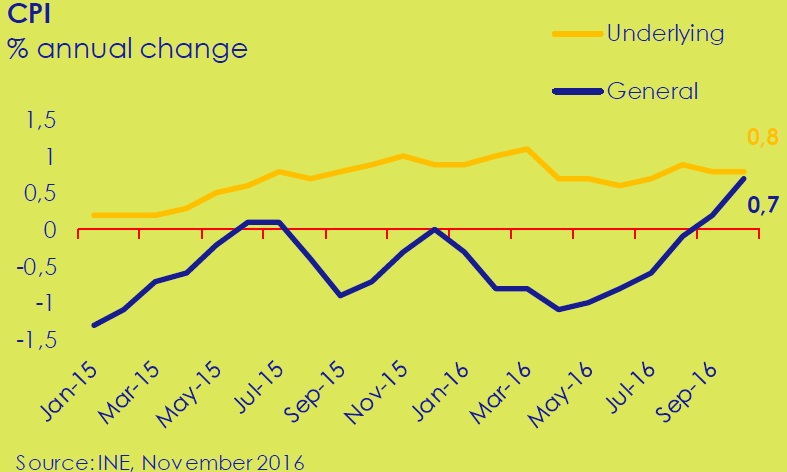
This development is explained principally by the rise in prices for fuel (gasoil and gasoline) and for electricity.
All of Spain’s Autonomous Communities registered higher and growing levels of inflation. The greatest increases were in Andalusia, Cantabria, Castilla y León, Galicia, Asturias and the Balearics. For its part, Extremadura registered the smallest increase.
▼
EUROPE
Autumn predictions European Commission
Moderate growth in the Eurozone will continue, with predictions of 1.7% for 2016 and 1.5% in 2017. The recovery will continue to be based on private consumption and investment, which are favored by the ECB’s expansionary monetary policy and by an anticipated more expansive tax policy, while petroleum is no longer as cheap as it was, and the euro is no longer depreciating.
The evolution in the Eurozone is conditioned by the weakness in growth in the EU and world trade and by greater political uncertainty.
Posibles consecuencias de un Brexit duro
According to a report of the British Government, if there is a hard Brexit, the UK, among other consequences, would lose access to the single market and would come to depend on the rules of the WTO, which might bring about:
- A GDP between 5.4% and 9.5% lower after 15 years.
- A loss of almost 73,000 million euros in
annual tax collection. - ▼
INTERNATIONAL
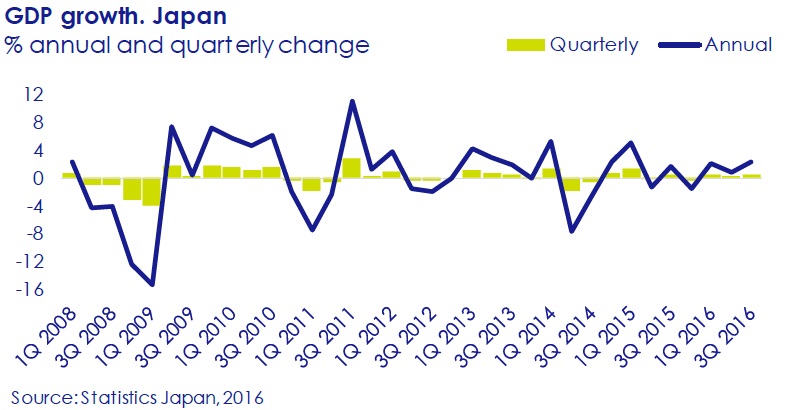
Japan 3Q 2016
The Japanese economy grew 2.2% year-onyear (0.5% quarter-on-quarter), thus linking three consecutive quarterly advances for the first time since 2013. This development is explained principally by the 2% increase in exports, mainly of electronic components, the increase in demand for Japanese products by the EU, and the weakness of the yen.
In spite of this positive data, there are still doubts about a sustainable recovery because of stagnation in domestic consumption (practically 60% of the economy), which advanced only minimally (by 0.1%) and in company investment. By contrast, public investment contracted 0.7% quarter-on-quarter.
Environmental sustainability
Over the past three years, the world economy has grown (an average of 3%) without a substantial increase in world emissions of carbon dioxide from fossil fuels and the industrial sector (▲0.7% in 2014, ▲0.06% in 2015, and ▲0.2% expected for 2016, vs. ▲2.3% average between 2004 and 2013). Nevertheless, if we want to put a brake on global warming, emissions should diminish by 0.9% annually until 2030.
The countries that have played the greatest role in moderating their emissions are China and the USA. China, the world’s most contaminating country (29% of the world total in 2015), reduced them 0.7% in 2015 (-0.5% predicted for 2016) (vs. ▲5.3% per year between 2005 and 2014). For its part, the
United States, the second largest polluter (15%), cut them by 2.6% in 2015 (-1.7% predicted for 2016). By contrast, the 28 countries of the EU (10% of
world emissions) augmented emissions by 1.4% in 2015, and India (6.3% of the total) by 5.2%.
Source: East Anglia University (United Kingdom) and Global Carbon Project, 2016.