GDP, Spain
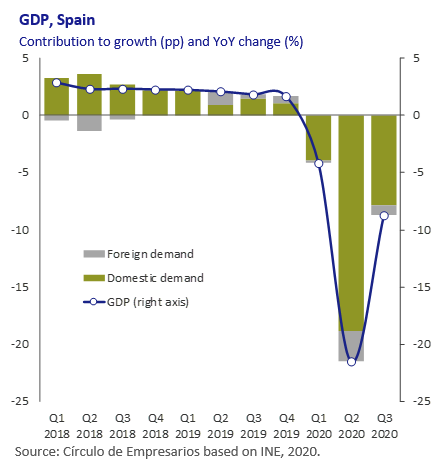
In Q3 2020, GDP rose 16.7% quarterly (compared to -17.8% Q2 2020), the biggest increase since quarterly reporting began. This development is due to the resumption of economic activity after the end of the household lockdown from previous months, and the recovery of activity during the summer months.
In year-on-year terms, after the -21.5% decrease in Q2 2020, GDP decreased 8.7% (against +1.8% in Q3 2019), with negative contributions from both internal demand (-7.8pp against +1.5pp in Q3 2019), and external demand (-0.9pp against +0.3pp). With regard to demand, spending on final consumption fell 6.8% year-on-year (against +1.4% in Q3 2019), in light of the 10.4% slump (against +1.1%) in household consumption, and in spite of the fact that public spending increased 3.7% (against +2.2). At the same time, investment fell 12.8% year-on-year (against +1.9% Q3 in 2019). In the external sector, exports of goods and services fell 17% and 15.7% yearon- year respectively.
On the supply side, the sector with the poorest evolution was construction, with a 11% decrease year-on-year. It is followed by services, at -9.8%, with trade, transport and the hospitality and leisure sector (-22% year-on-year) and artistic and recreational activities (-18.5%) standing out. Industry also fell -3.6%. On the other hand, the agriculture, livestock farming, forestry and fisheries sector increased 5% year-on-year.
Tourism sector, Spain
In September, the inflow of international tourists fell 87.1% year-on-year (against -1% in September 2019), to 1.1 million visitors. So far this year, this decrease has been 74.9% year-on-year (16.8 million tourists), in contrast to the 1% increase in 2019.
In cumulative terms, by country of origin, the highest percentage of tourists came from France (19.4% of the total), although this represented a year-on-year rate of -64.2%. It was followed by the UK (16.8% of the total), with a year-on-year decrease of 80.8%, and Germany (12.9% of the total), at -75.8%. At the same time, total spending by tourists
dropped sharply by 89.9% year-on-year (against +0.7% in September 2019) to €967 million.
Up until September, it fell 75.9% year-onyear (€17.7 billion), against the increase of 2.5% in the same period of 2019.

EU growth
EU-27 GDP grew 12.1% quarterly in Q3 2020 after its collapse in the previous quarter primarily due to the lifting of restrictions on movement imposed by the authorities to halt the spread of Covid-19.
Although growth in the region has exceeded market expectations, it is still 4.3% below levels reached in Q4 2019. At the same time, the new wave of infections has obliged the authorities to impose new restrictions on movement, intensifying the slowdown in activity that was already starting to take place in August.
For its part, in October, the European Commission’s European Economic Sentiment Indicator remained stable at 90.9 points, accumulating four months of negative zone scores.
Among the main economies in the region, France’s growth at 18.2% quarterly (against -13.7% in Q2 2020) stands out, followed by that of Spain (16.7% against -17.8% previously), Italy (16.1% against -13%) and Germany (8.2% compared to -9.8%). The growth surge is mostly due to the increase in demand and the resumption of exports.
However, production levels are still at levels far below those at the start of the crisis. Spain is the worst-placed economy at 9% below the Q4 2019 levels, followed by Italy (4.6%), Germany (4.3%) and France (4.1%).

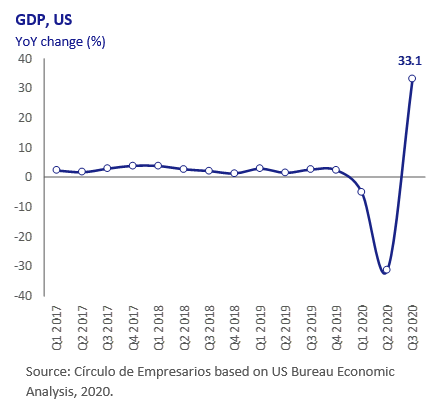
GDP, the US
In Q3 2020, US GDP grew on a quarterly basis at an annualized rate of 33.1% (7.4% quarterly), in line with growth predictions by Reuters (33%).
This historic upsurge, after a contraction in Q2 2020 (-31.4% quarter-on-quarter annualized), takes place in a context of the elimination of movement restrictions and a return to the job market, in which economic agents have
benefited from extremely favourable credit terms.
However, US GDP is still 2.9% below levels reached in Q3 2019.
By components, private consumption recovered sharply and grew 40.7%, mainly as a result of the increase in the purchase of consumer durables and the demand for services (the sector which was hardest hit during the lockdown).
In second place, investment in capital goods and residential investment stand out, registering a quarterly annualized increase of 70.1% and 59.3% respectively. For its part, trade decreased 3.1% fundamentally due to bigger increases in imports of goods and services.