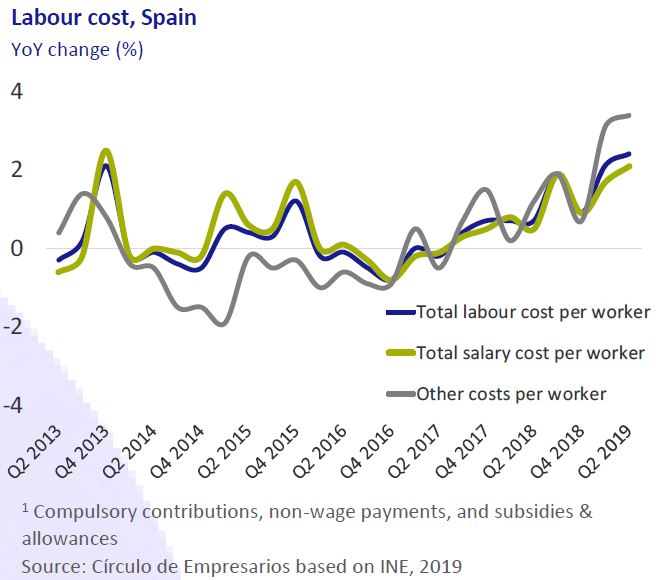
Labour cost, Spain
The rise in the minimum wage since January 2019 (22.3%) and the higher maximum contribution bases to Social Security (7%) are the main factors that explain the rise in
labour costs.
Specifically, in Q2 2019, the labour cost per worker increased by 2.4% year-on-year (2.1% in Q1 2019) to €2,664.55, the largest spike in 10 years. Since 2017, the year in which there is a change in trend, labour costs record acumulative annual increase of 3.26%. By components, salary costs rose by 2.1% year-on-year (1.7% in Q1 2019) and other costs1 by 3.4% (3.1% in Q1 2019), underlining the spike in social contributions (3,95%).
Real estate sector, Spain
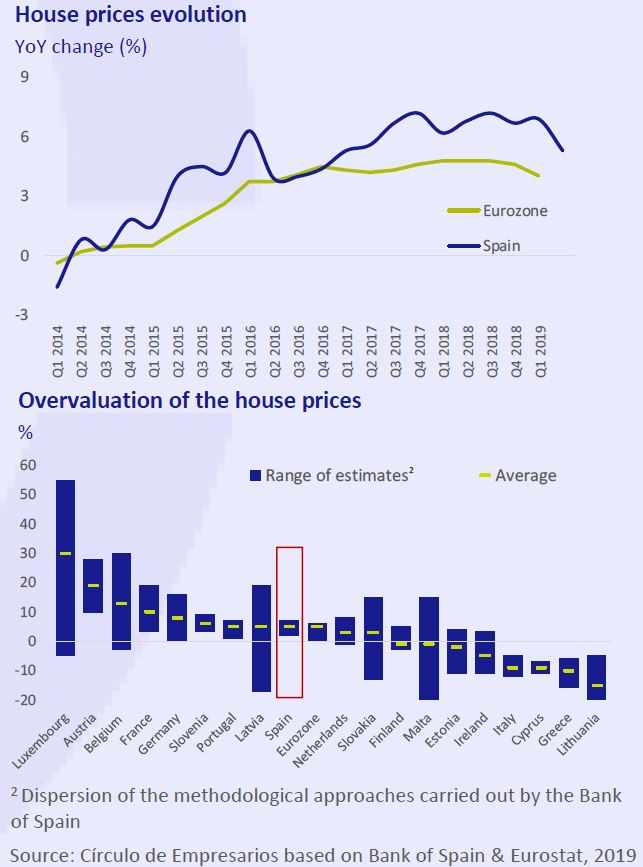
In Q2 2019, house prices increased by 5.3% year-on-year, 1.5pp less than in Q1 2019. This restraint is mainly due to the slowdown in the purchase and sale of homes (3.7% in Q1 2019 vs 7.5% in Q4 2018) given the grim outlook for the Spanish economy and its political instability. Since 2014, the average house prices have increased by 4.7% yearon- year.
Despite this trend, in Q1 2019, Spain recorded the 5th largest house price increase in the Eurozone after Portugal (9.2%), the Netherlands (8%), Slovenia (8%) and Latvia (7%).
This evolution does not translate into an overvaluation of the Spanish real estate market, which the Bank of Spain estimates to be at approximately 5%, on par with the Eurozone. The five countries with the highest overvaluations in house prices are Luxembourg (30%), Austria (20%), Belgium (13%), France (10%) and Germany (10%).
Business sector, Spain
In July, the number of companies increased by 7,820, representing an increase of 1.6% year-on-year, which is still 1.9pp less than in the same period of 2018. By sectors, the incorporation of companies occurred mainly in retail (19.1% of the total) and the real estate sector (17.6%). In turn, the number of dissolved companies amounted to 1,662, an increase of 9.2% year-on-year, mainly in industry and energy (22.7%) and in retail (17.8%).
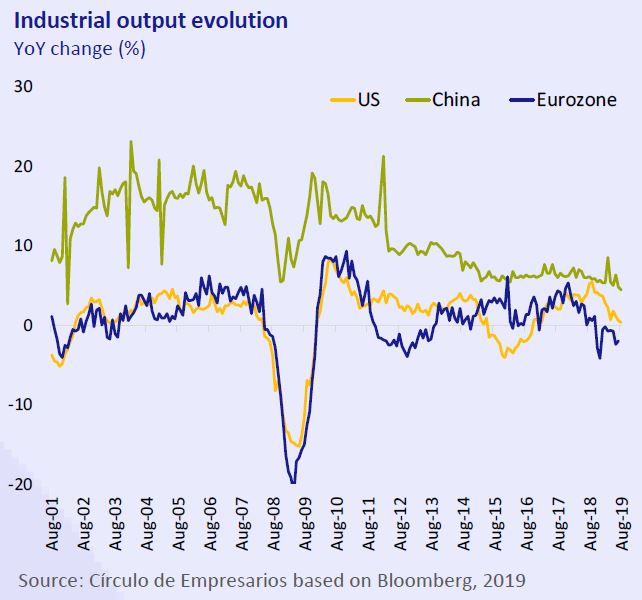
Industrial production
In a context of global economic slowdown with mounting geopolitical risks (tensions in Saudi Arabia, Iran and Hong Kong), the industrial sector continues to show signs of fragility not only in the Eurozone but also in the US and China.
Eurozone
In July, the industrial production in the Eurozone fell by 2% year-on-year for the sixth consecutive month.
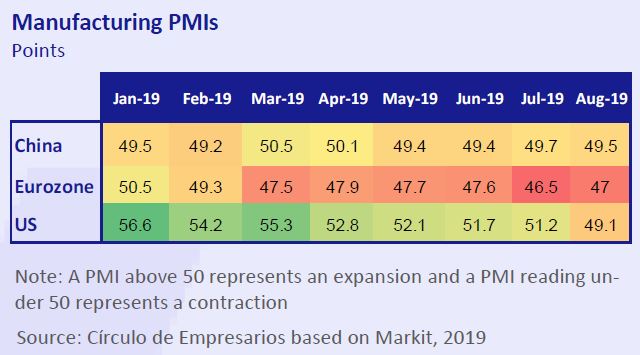
Among its main economies, Germany reported the largest contraction (–5.3%), 5pp and 4.6pp more than in Italy and France, respectively. As for Spain, its industrial production rose at a moderate 0.3% year-on-year, compared with an average of 1.3% in Q2 2019. Among the leading indicators of the sector, since February, the Eurozone manufacturing PMI remains in the contraction zone, currently standing at 47 points. This evolution confirms the feebleness of production, demand for new orders, and business confidence, which are at record lows since November 2012.
US
In August, the US industrial production rose at a moderate 0.4% year-on-year, compared with 5.3% in the same month of 2018. Whereas, the manufacturing PMI slipped into the contraction zone with 49.6 points for the first time since 2016.
China
In August, China’s industrial production rose by 4.4% year-on-year, its lowest rate since 2002, well below the forecasted range between 5.2% and 5.5%.
The Purchasing Managers’ Index (PMI) of the Chinese manufacturing sector dropped to 49.51 points, remaining for the fourth consecutive month in the contraction zone, mainly due to the fall in new orders and the shaky external demand.
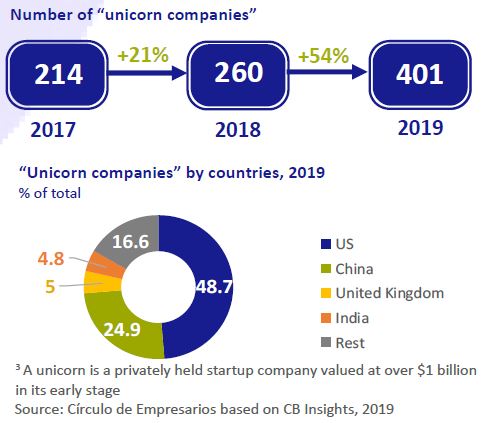
“Unicorn companies”
Currently, the number of unicorn companies3 worldwide amounts to 401 companies, 54% more than in 2018, reaching a total value of $1.2 trillion (1.4% of world GDP).
By countries, the US accounts for 48.7% of the total, and China for 24.9%. In Europe, the United Kingdom is the country with the most unicorn companies, while Spain only has one.
The sectors with the most unicorns are: Fintech (11.8% of total companies), e-commerce (11.8%), software and internet services (11.6%), and artificial intelligence (11.1%).